|
Learn more about create an odor rose map from your data in your Odor Track'r odor monitoring database.
| |
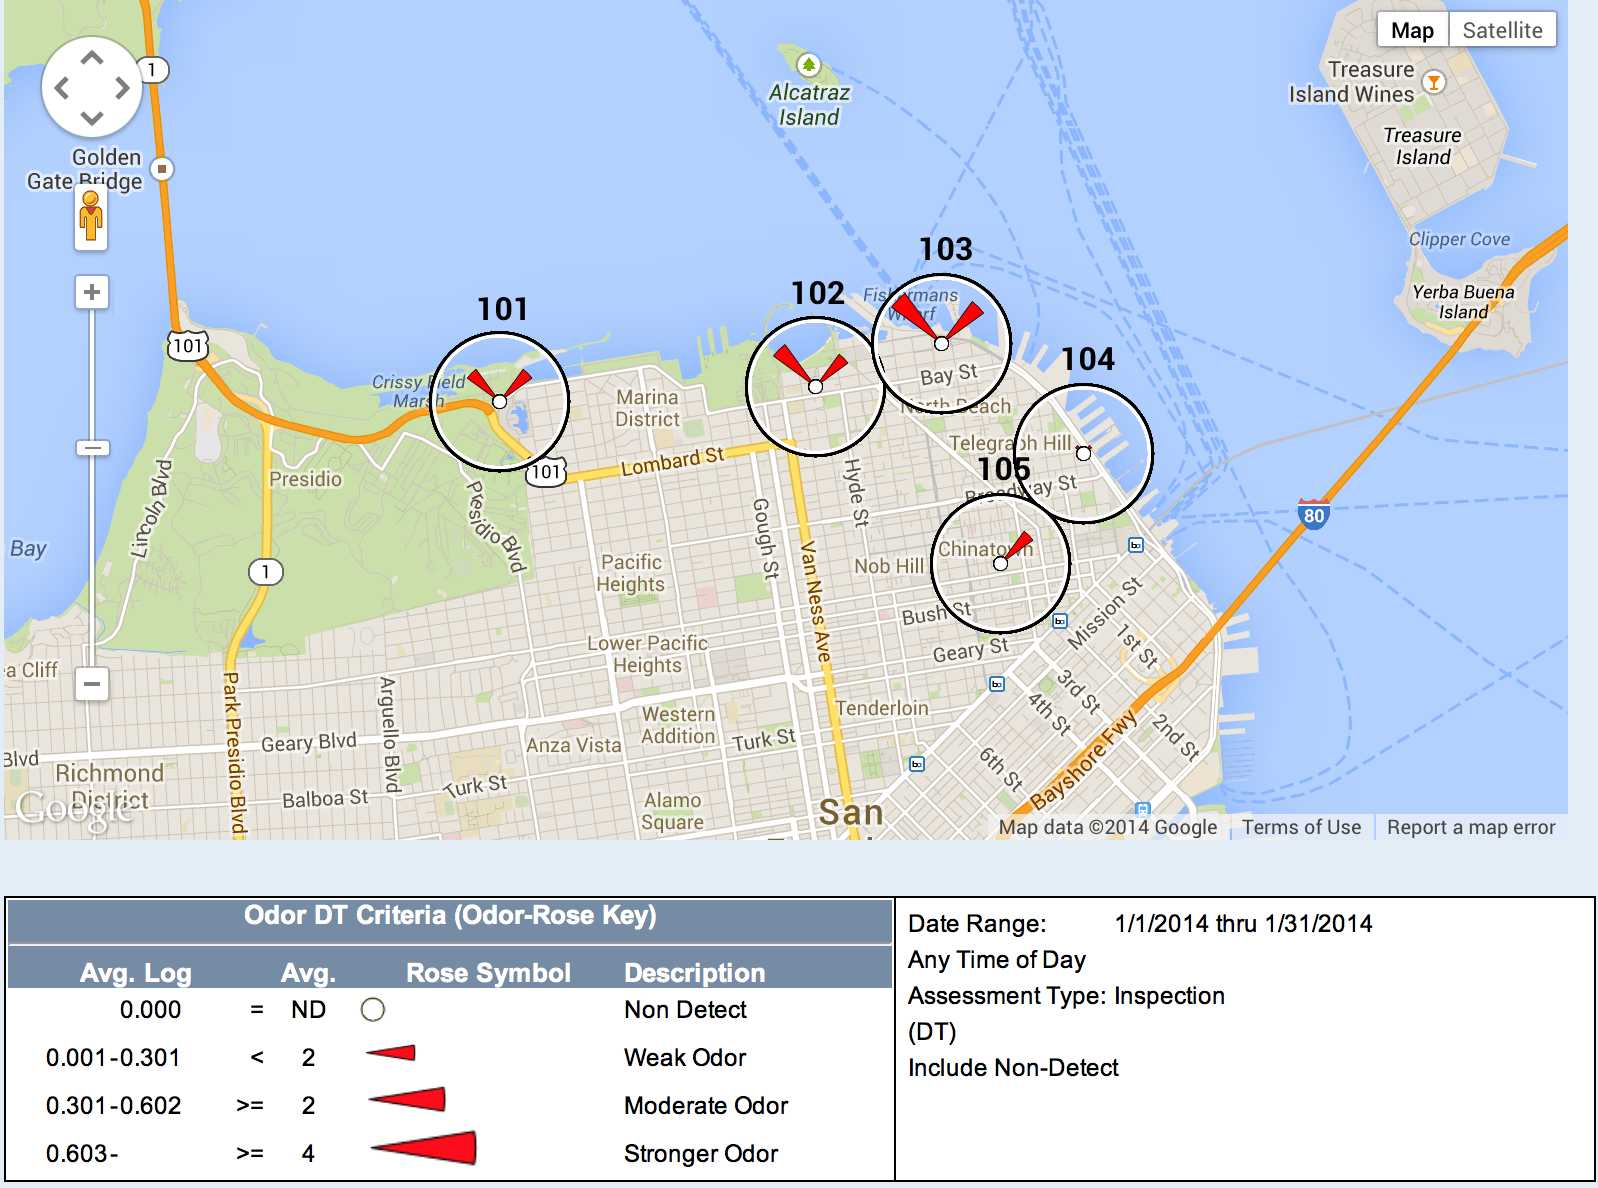
This Google Map image is created in the video tutorial below. |
| |
 |
| |
|
For optimum viewing experience, click the framed box in the lower right corner of the video for full screen view.
Additional Tips
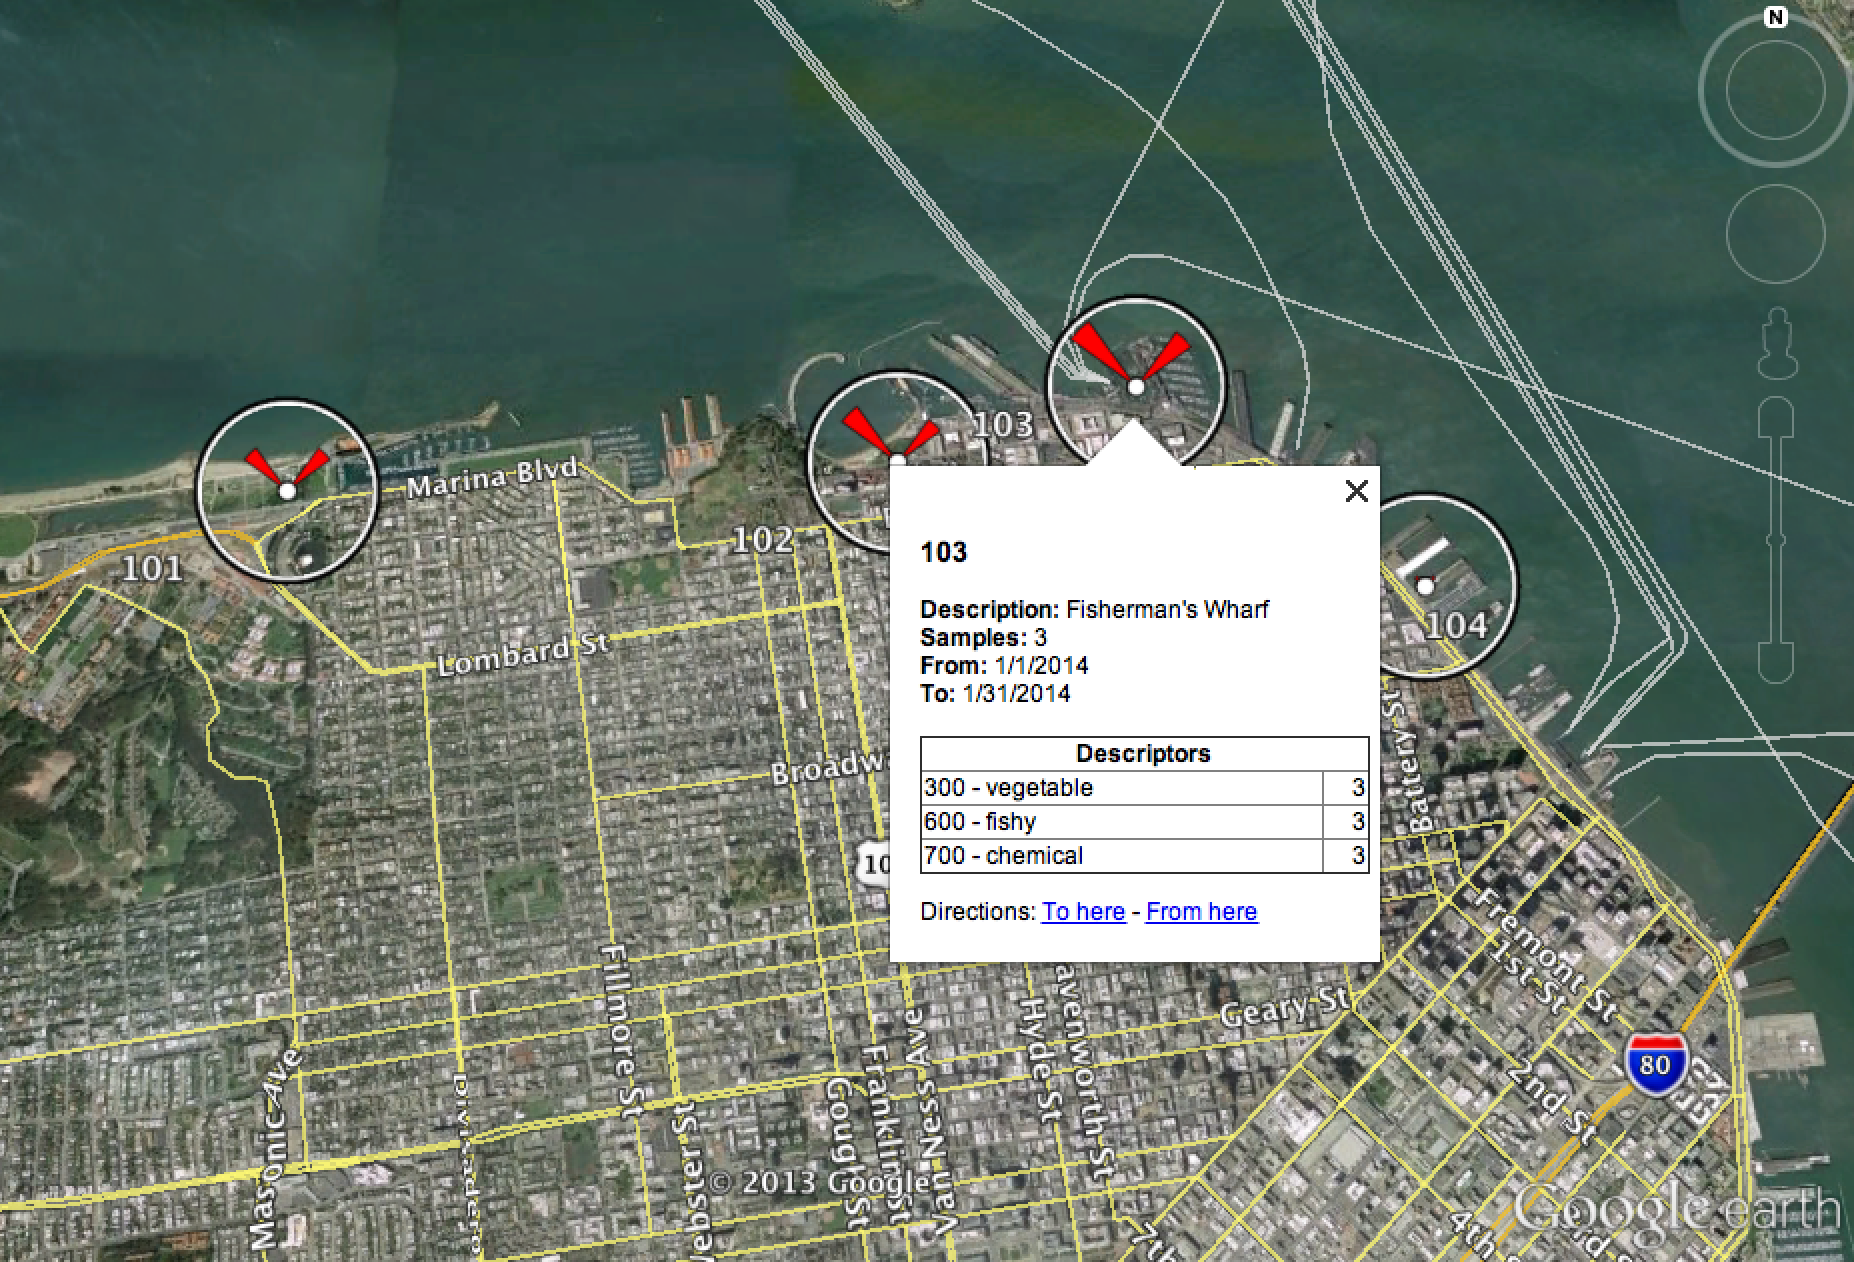
#1. Within Google Earth or Google Maps, click a location to view summary data (see image below).
#2. The Odor-Rose map graphic is most helpful for a single inspection or for all inspections for one-day. Search criteria for multiple days with many wind directions may produce Odor-Rose graphics that are difficult to visualize. If you want to use a broad date range in your search criteria, consider narrowing the wind direction criteria to one or two wind directions.
#3. Select a Rose Petal Color that will "jump" from the map rather than a color that may blend with the map background. Use a different rose petal color for different search criteria to help tell your story using different maps.
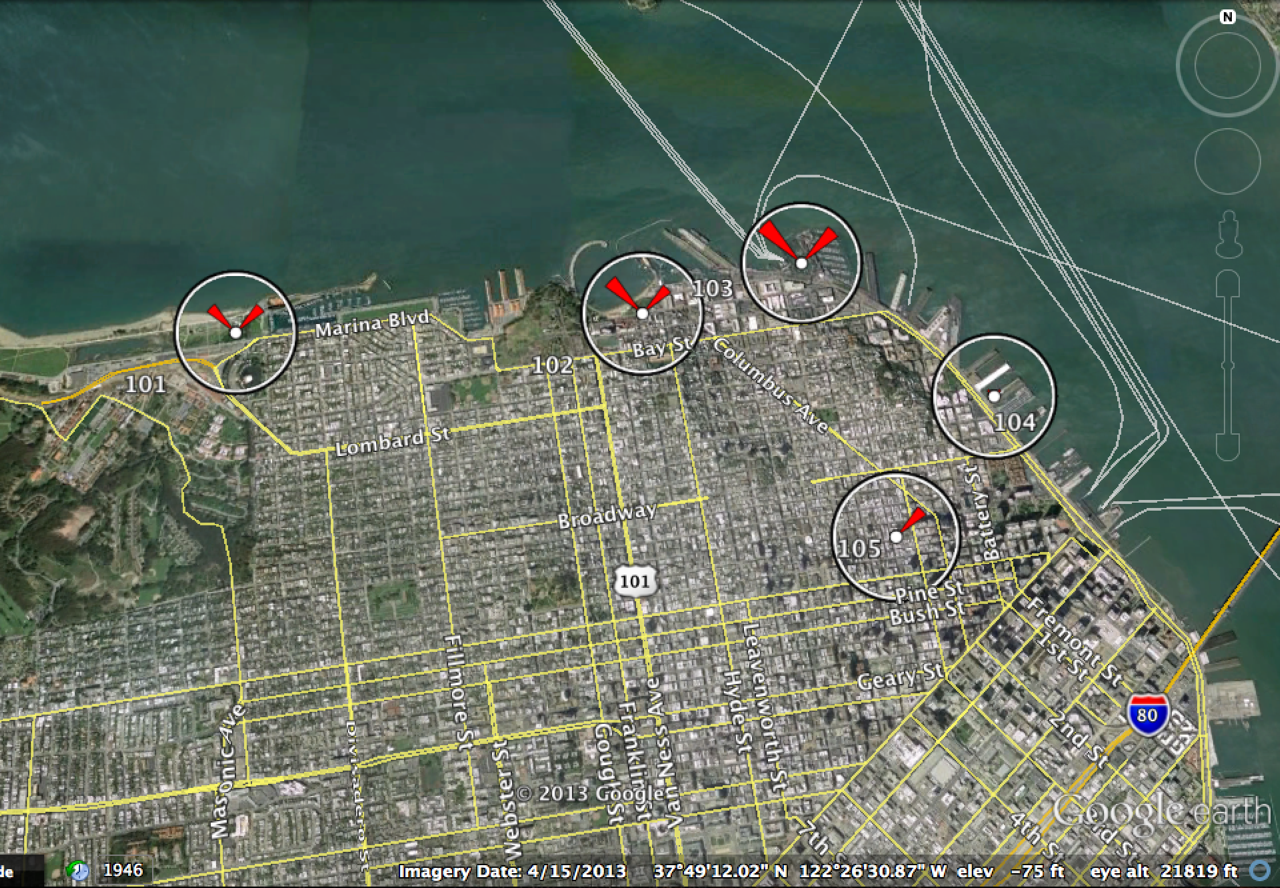
Google Earth Version of Odor Rose Map.
In this version, the location is highlighted with summary data.
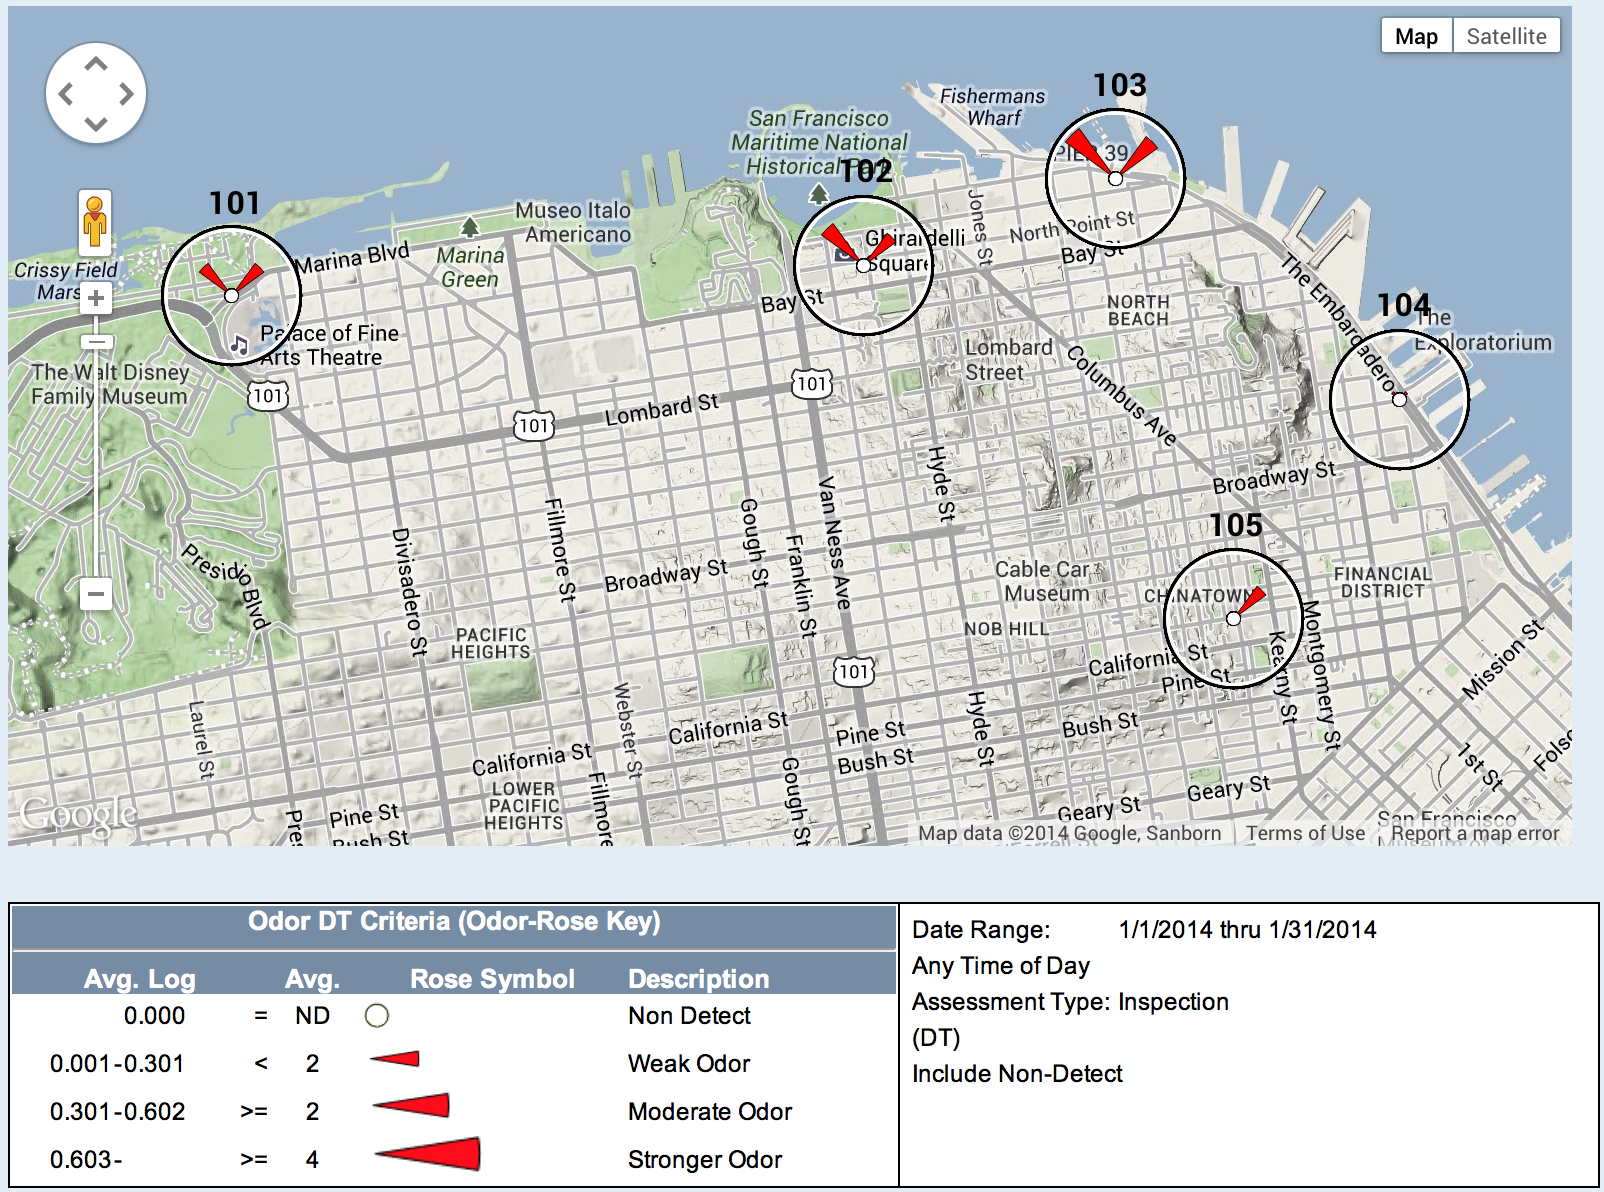
This version was created with the "terrain" feature enabled in Google Maps.
|
Note: The data shown in the Odor Track'r Program how to videos are fiction and were created for illustrative purposes only.
|
|